
A HISTORICAL PERSPECTIVE
Market Volatility Spotlight
Global markets have been volatile in reaction to America's tariff imposition on the global economy, leading to sharp declines. We've experienced market shocks before, most recently with the 2020 global pandemic. After each of these events, markets eventually recovered and went on to reach new highs.
S&P/TSX Total Return Index
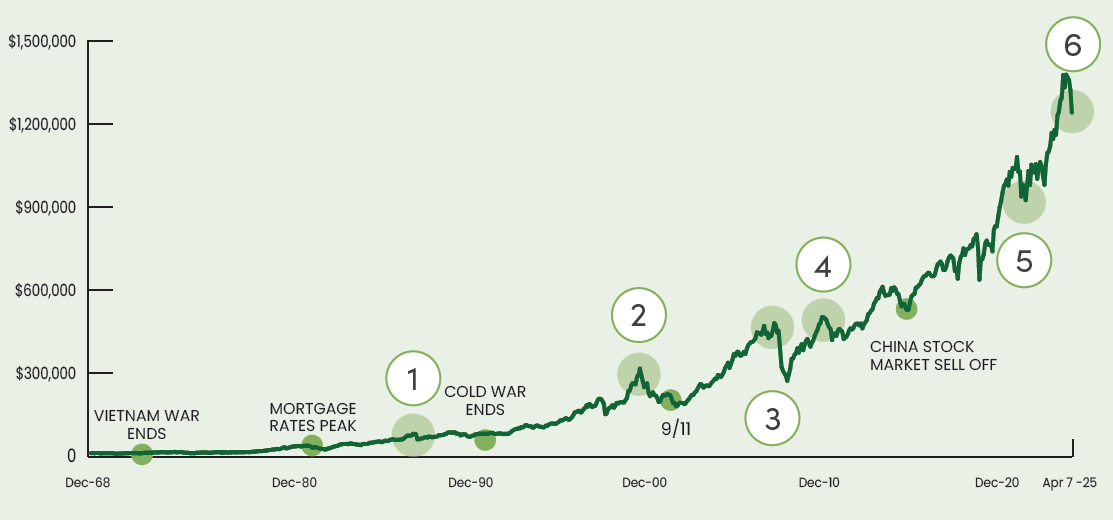
Markets trend up in the long-term
Historically, the markets recovered after each downturn demonstrating that ups and downs are part of stock market performance and something long-term investors are used to riding out.
Black Monday
Jul '87-Nov '87
-25.4%
Dot Com Bubble
Aug '00-sep '02
-43.3%
U.S. Financial Crisis
May '08-Feb '09
-43.2%
Stock Market Downturn
Mar '11-may '12
-15.8%
Coronavirus Crash
Jan '20-Mar '20
-22.3%
Global Trade War
Jan '25-apr 7, '25
-10.9%
(1)This graph illustrates historical performance of the S&P/TSX Total Return Index. A $10,000 investment in January 1969 grew to $1,224,638 on April 7, 2025. Market downturn calculations refer to the five downturns noted in the above graph and use month-end closing value of the S&P/TSX Total Return Index.
Recovering from Down Markets

21.9%
The S&P/TSX index increased by an average of 21.9% during the first twelve months following the bottom of these market downturns.

20.8 months
The average length of time it took these down markets to return to their original high was 20.8 months.

5.6 years
The average length of market growth between these down markets was 67 months or 5.6 years.
It's Best to Stay Invested
Timing the market is always difficult. As much as investors may feel like doing something with their portfolio in periods of volatility, remember that it’s much easier to exit positions than to get back into the market. No one knows when the rebound will occur, but when it does, it can happen quickly. Missing the rising tide may cause more damage to a long-term investment plan.
| 10 Years ended December 31, 2024 | Annual Return (2) |
|---|---|
| Staying Invested | 8.65% |
| Missing the 10 best trading days | 3.43% |
| Missing the 30 best trading days | -1.41% |
| Missing the 50 best trading days | -4.93% |
If your financial situation has changed or you have concerns about your investment portfolio given the current market conditions, it's important to talk to us for guidance.
Source: 1. S&P Global | 2. Investment Planning Counsel, Morningstar Direct. January 2025. (Based on the S&P/TSX Composite Total Return Index)
Trademarks owned by Investment Planning Counsel Inc. and licensed to its subsidiary corporations. Investment Planning Counsel is a fully integrated wealth management company. Mutual funds available through IPC Investment Corporation and IPC Securities Corporation. Securities available through IPC Securities Corporation, a member of the Canadian Investor Protection Fund. Insurance products available through IPC Estate Services Inc. Canada Life Investment Management Ltd. is an affiliated entity to IPC Investment Corporation and IPC Securities Corporation. © Copyright 2025. Ativa Interactive. All Rights Reserved.